The COVID-19 pandemic continues to disrupt how people live and work. According to Gallup’s most recent Work and Education poll, the average number of days that U.S. workers are working from home has more than doubled since last year. The same research shows that 34 percent of American workers have been working entirely or mostly from home in recent weeks. The increase in remote work means that U.S. workers are relying even more on technology, which could have an effect on the demand for IT administrators—a group that was in demand even before COVID-19.
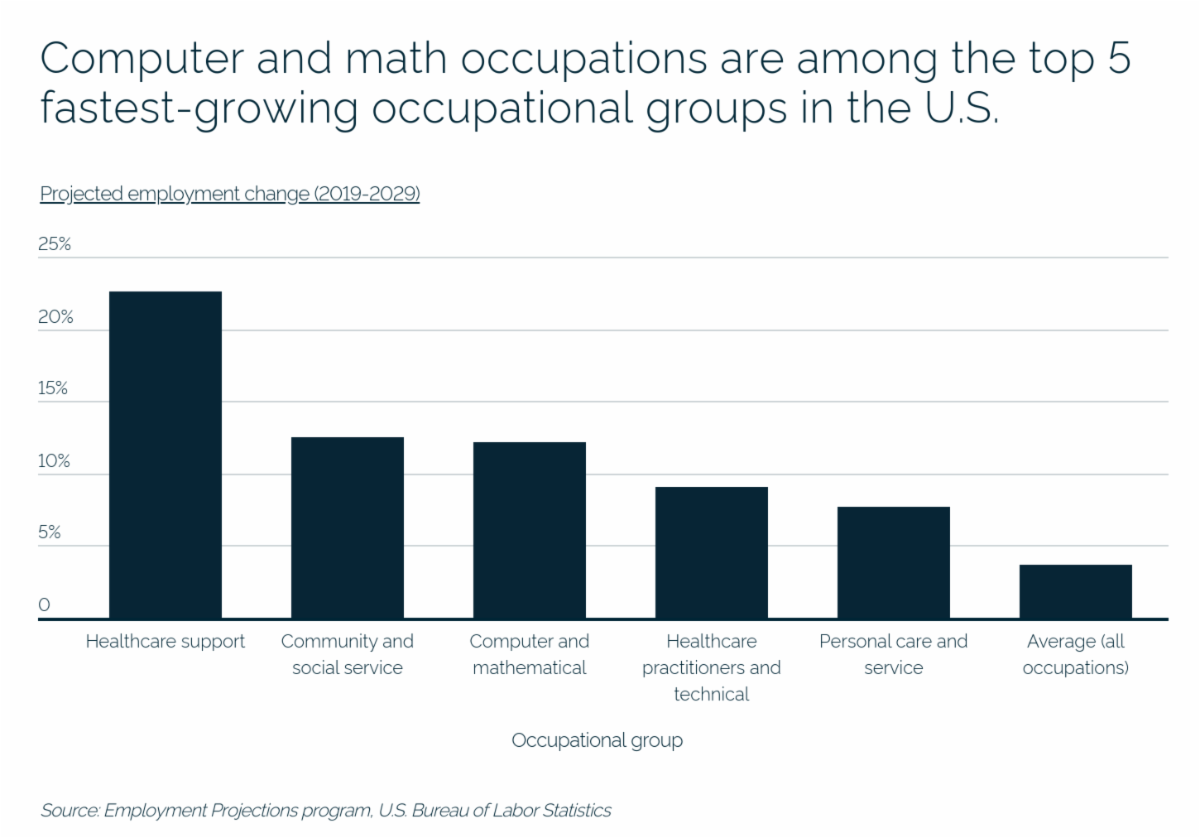
Compared to most other occupational groups, computer and math occupations are in high demand and have a positive job growth outlook. According to the Bureau of Labor Statistics, the 10-year projected growth rate for all occupations is only 3.7 percent. However, the projected employment change for computer and math occupations during this time frame is 12.1 percent, only behind healthcare support occupations and community and social service. Notably, these numbers were calculated for 2019–2029, before the pandemic started.
 Even within computer and math occupations, there is some variation in job outlook and demand. More specifically, IT administrators (defined by the Bureau of Labor Statistics as “Network and Computer Systems Administrators”) have a lower projected growth rate than the group overall. In fact, the 10-year projected growth rate for Network and Computer Systems Administrators is only 4 percent. The BLS Occupational Outlook Handbook notes that a potential reason is the increase in cloud computing, which could raise existing workers’ productivity while decreasing employment growth.
Despite average projected job growth, IT administrators still earn far more than most workers overall and have plentiful remote work opportunities. The higher salaries are in part due to specialized training and education, since most employers require IT administrators to hold a bachelor’s degree in computer or information science. Nationwide, IT administrators earn a median wage of $83,510, more than twice the national median for all occupations ($39,810).
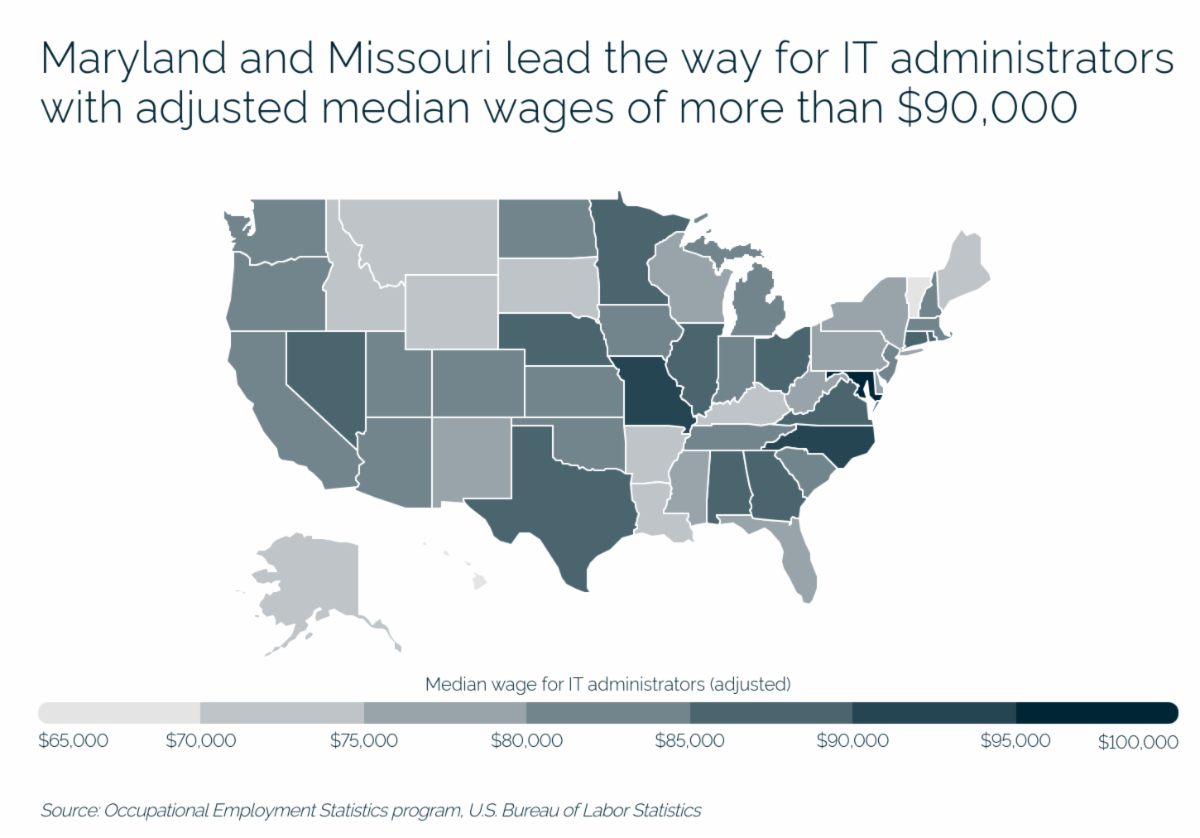
Salaries for IT administrators vary across the country, and there are a lot of locations outside of major tech hubs that offer great pay for IT workers. At the regional level, states in the South and the Midwest offer some of the highest salaries for IT administrators when adjusted for cost of living. In fact, the adjusted median wage for IT workers is above $90,000 in Maryland, Missouri, and North Carolina. On the other end of the spectrum, Vermont and Hawaii pay the least with adjusted median wages of less than $70,000. Mountain states such as Idaho, Montana, and Wyoming also offer below-average wages when adjusted for cost of living.

To find which states offer the best salaries for IT administrators, researchers at Spanning analyzed median wage and employment data from the U.S. Bureau of Labor Statistics 2019 Occupational Employment Statistics (OES). All median wages were adjusted for the location’s relative cost of living, based on the U.S. Bureau of Economic Analysis Regional Price Parity. For reference, the ranking also includes the unadjusted median wages of IT administrators and all workers in the state, the total number of IT administrators employed, and the cost of living relative to the national average.
The analysis found that in Georgia, IT administrators earn an adjusted median annual wage of $89,527. Out of all U.S. states, Georgia is the 5th best-paying for IT administrators. Here is a summary of the data for Georgia:
-
Median wage for IT administrators (adjusted): $89,527
-
Median wage for IT administrators (unadjusted): $83,260
-
Median wage for all workers (unadjusted: $36,930
-
Number of IT administrators: 9,150
-
Cost of living: 7.0% below average
For reference, here are the statistics for the entire United States:
-
Median wage for IT administrators (adjusted): $83,510
-
Median wage for IT administrators (unadjusted): $83,510
-
Median wage for all workers (unadjusted: $39,810
-
Number of IT administrators: 354,450
-
Cost of living: Average
For more information, a detailed methodology, and complete results, you can find the original report on Spanning’s website: https://spanning.com/
